Data Node visualisation
The AiiDAlab ChemShell plugin supports a wide range of data visualisation options for both calculation inputs and outputs. A selection of currently supported visualisation widgets is given below.
Structure Visualiser
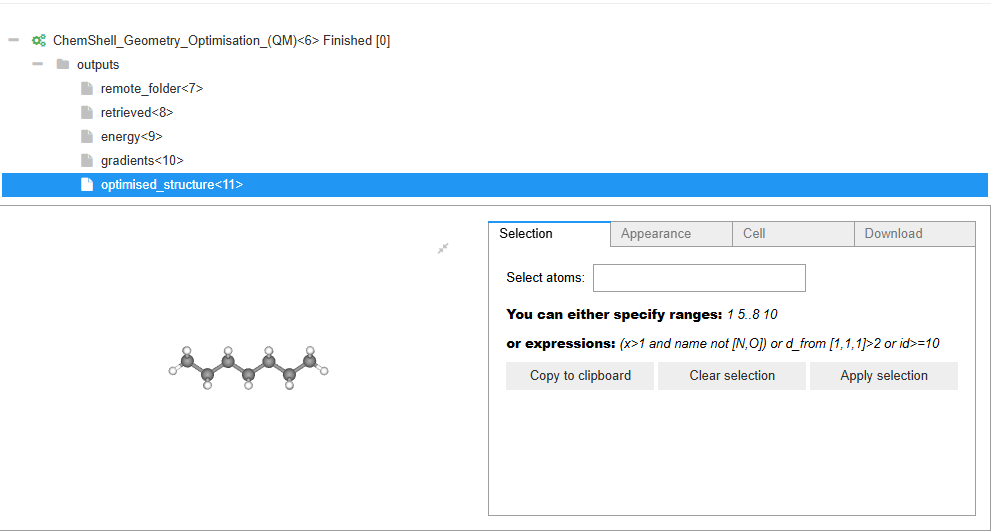
One of the core abilities of the AiiDAlab ChemShell UI is to visualise chemical structures. This is the same visualiser as used in the structure input step but here it is used to visualise calculation results such as the optimised geometry of the given structure.
Array Visualiser
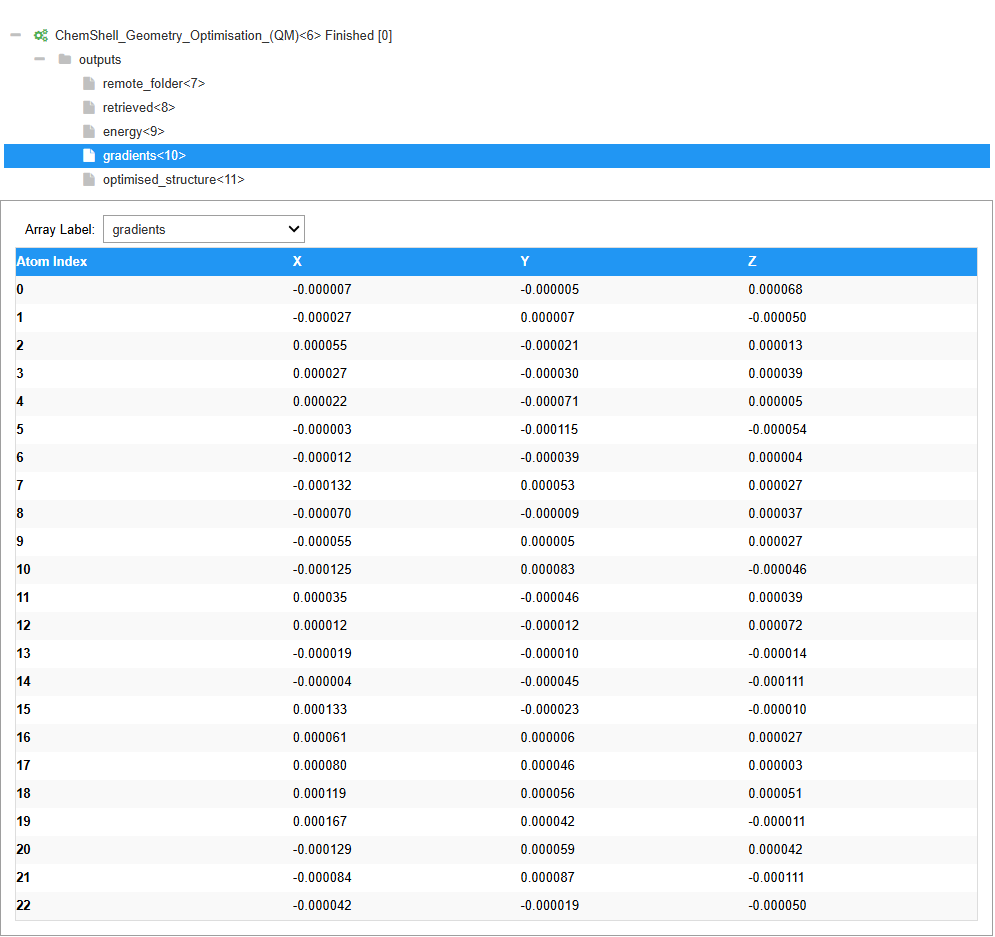
Certain job types in ChemShell return an array of values, such as the forces on each atom after a single point calculation or geometry optimisation. These can be visualised in a table as shown here,
Folder/File Visualiser
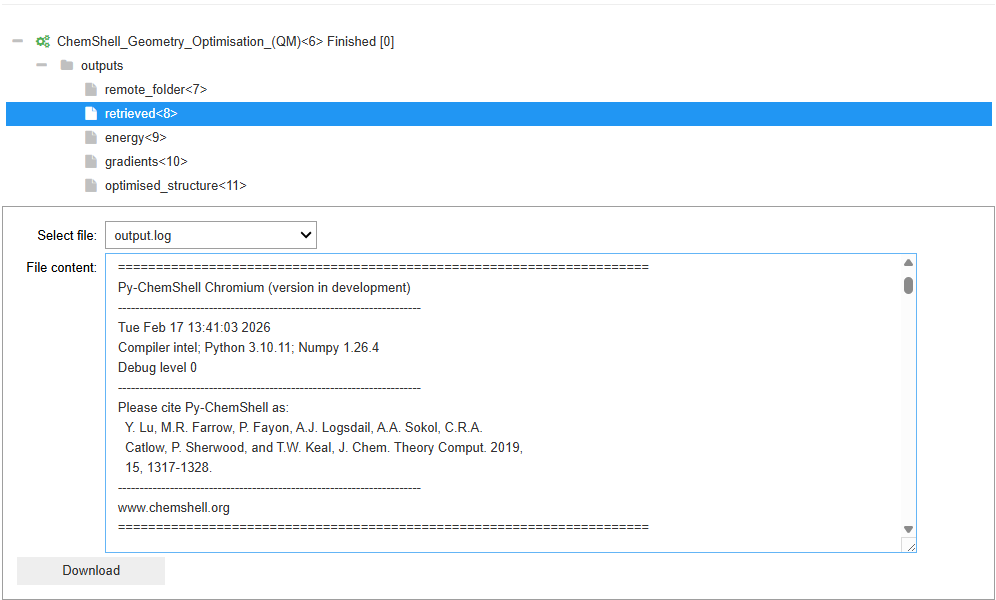
By default AiiDA produces a dictionary style folder object which contains all the files that were returned as part of the AiiDA (ChemShell) process. All the items within this folder can be viewed as files and can be switched between using the drop down menu provided. As part of the retrieved objects dictionary that AiiDA returns for any ChemShell process the main ChemShell output log is included (output.log) and can be viewed directly in the UI.
Single Value/AiiDA Node Viewer
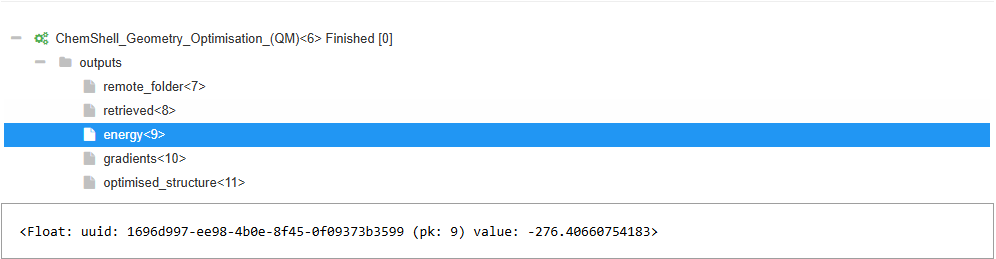
Any value that is simply a single value (integer/floating point) or a type that doesn’t have a dedicated visualiser is viewer as an AiiDA data noe. This includes the type, uuid, node pk and the value if it is a simple data value. The example shown is for a single floating point number that corresponds to the final energy of the system that has been optimised.
Note
Energies outputted by ChemShell are typically in atomic units (Hartree). Common conversions are:
1 Hartree
27.211386 eV
2625.50 kJ/mol
627.509 kcal/mol
2.194746 wavenumbers
4.359745x10⁻¹⁸ Joules