Note
Go to the end to download the full example code.
Phonon band structure from CASTEP force constants
Run DispersionWorkChain on quartz force
constants (a CASTEP .castep_bin), plot the band structure, and visualise the
AiiDA provenance graph that produced it.
Set up AiiDA
A shared helper loads a temporary in-memory profile and a localhost Python code
(see _aiida_setup.py). Nothing here touches your real AiiDA configuration.
from _aiida_setup import example_data, get_python_code, show_provenance
from aiida import orm
from aiida.engine import run_get_node

code = get_python_code()
Run the dispersion workflow
The workflow reads the force constants (a PythonJob), builds a seekpath q-point path, interpolates the phonon modes, and composes a band structure.
from aiida.plugins import WorkflowFactory

# Load via WorkflowFactory (direct imports like
# `from aiida_pythonjob_ins.workflows import DispersionWorkChain` also work)
DispersionWorkChain = WorkflowFactory("pythonjob_ins.dispersion")

results, node = run_get_node(
    DispersionWorkChain,
    castep_file=orm.SinglefileData(example_data("quartz.castep_bin")),
    q_spacing=orm.Float(0.05),
    code=code,
)
print(f"WorkChain finished OK: {node.is_finished_ok}")
print(f"Outputs: {sorted(results)}")
Written to /tmp/tmp9prsijhl/euphonic_object.json
Written to /tmp/tmpuf0zqm17/euphonic_object.json
WorkChain finished OK: True
Outputs: ['band_path', 'band_structure', 'phonon_modes', 'structure']
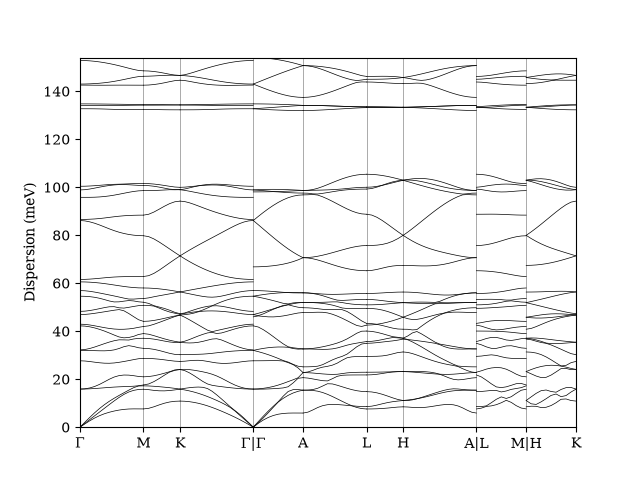
Plot the band structure
The output is a native AiiDA BandsData; use its built-in matplotlib plotting.
bands = results["band_structure"]
bands.show_mpl()
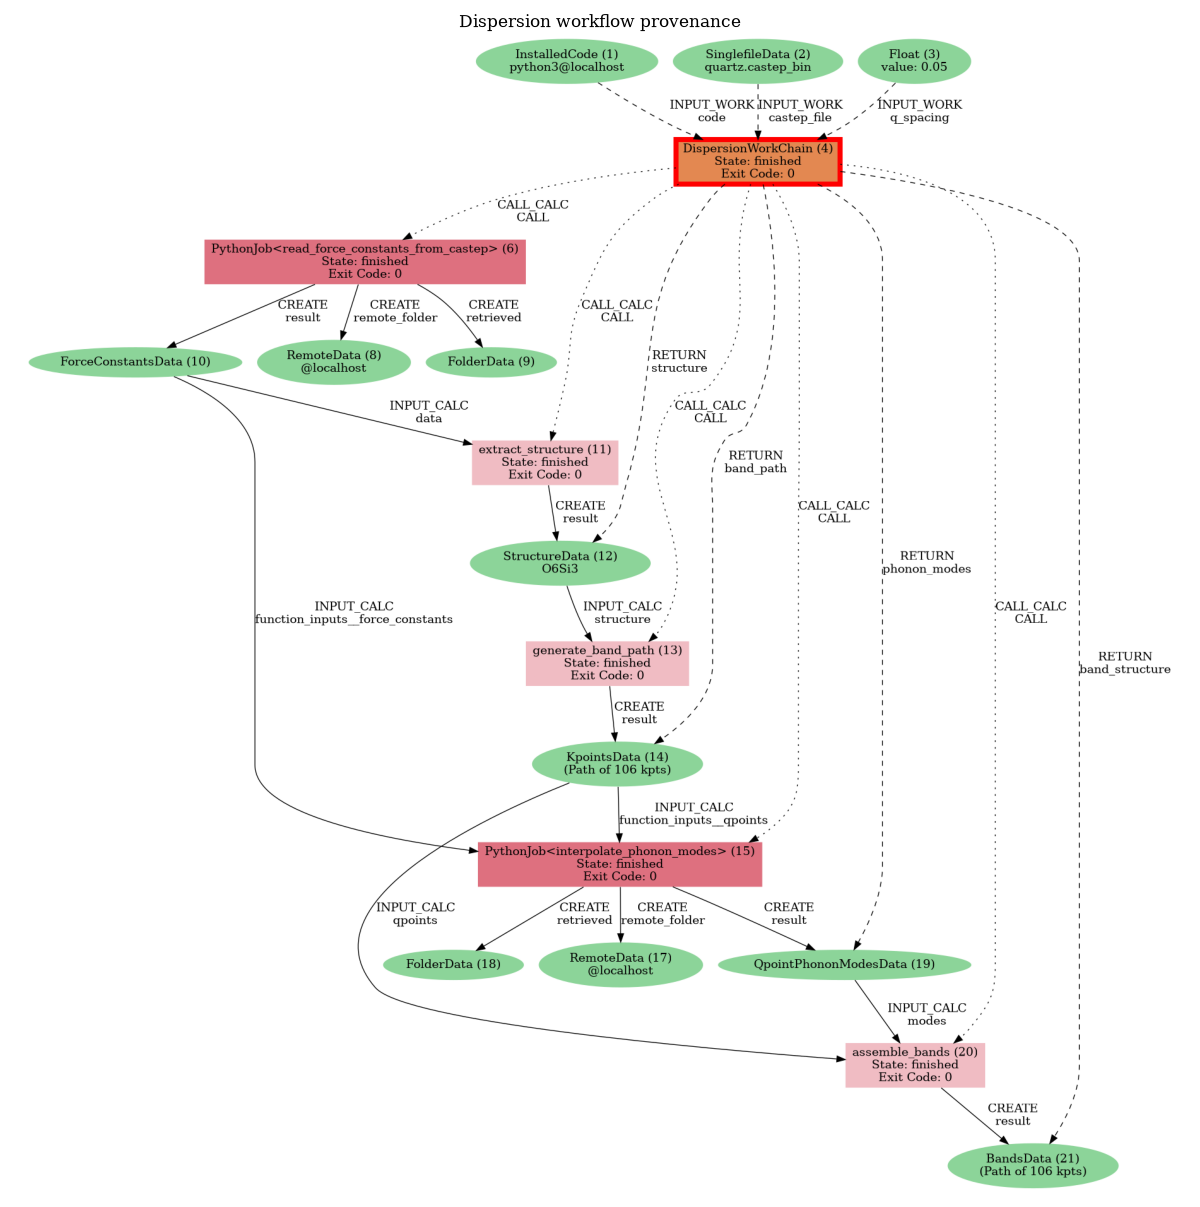
Provenance
Every step – the read/interpolate PythonJobs and the structure/path/bands calcfunctions – is recorded. Here is the graph that produced the band structure.
show_provenance(node, title="Dispersion workflow provenance")
<Figure size 1200x1207.91 with 1 Axes>
Total running time of the script: (0 minutes 9.805 seconds)